What if we told you it's possible to reduce the carbon footprint (and costs) of dishes by simply swapping to ingredients with a lower footprint?
We’ve already covered the basics on the carbon emission of different types of food which clarified that certain ingredients (like beef) have a higher carbon footprint than others (such as chicken or tofu). We also covered the scientific approach on how that impact is measured and calculated.
When food professionals are calculating the carbon emission of recipes within the Klimato tool, they know that the best option to reduce the footprint of their dishes is to search for substitute ingredients with a lower footprint and swap them out. These changes can also contribute to making dishes more profitable alongside decreasing the carbon footprint.
To make your life easier, we created an expert cheat sheet for these swaps based on our Science Team’s insights.
1. Animal Products
|
Ingredient |
CO₂e/kg |
Ingredient Swap |
CO₂e/kg |
Carbon saving |
|---|---|---|---|---|
|
Chicken |
5.98 |
Tofu |
1.95 |
67% |
|
Beef |
34.67 |
Lentils |
0.77 |
98% |
|
Shrimp |
18.02 |
Mussels |
1.62 |
91% |
|
Pork |
7.07 |
Beans |
0.77 |
89% |
|
Haddock |
3.62 |
Pollock |
0.99 |
73% |
|
Cod |
2.29 |
Pollock |
0.99 |
57% |
|
Eggs |
3.69 |
Chickpea water (aquafaba) |
0 |
100% |
|
Values are extracted from the Klimato database which contains data from peer reviewed papers, conference proceedings and open source databases. |
||||
In this table, you can find an overview of animal products, their carbon footprint in kg CO2e/kg, and some climate-smart ingredient swaps that could significantly reduce your recipe’s carbon footprint. When looking at beef - one of the highest emitting ingredients - there are multiple options available if you want to swap it out for a more sustainable ingredient. For instance, if vegan options are not available, we’d recommend choosing chicken instead, which has a carbon footprint that is 5 times lower.
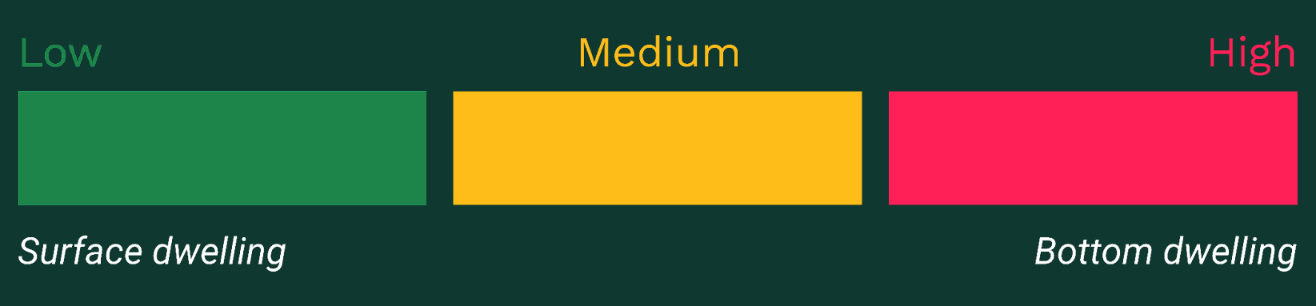
Note for the ingredient swapping method: On the left hand side, marked by red are the ingredients to be swapped, having the biggest CO2e emission, then the yellow ones in the middle are the ingredients we recommend to be used instead and in green is the percentage of carbon saved. You can find “Klimato’s Sustainable Swap” at the end of each section.
All of the numbers presented here are sourced from the Mothership - Klimato’s Database which is a unique set of data collected and maintained by our scientists.
1.1 Fish
Two of the main factors affecting the climate impact of sea creatures are the fishing area and the fishing method
This is due to the fact that the highest emissions in capture fisheries come from fuel use (≈ 70%) (1). Therefore, species living off-shore and/or in the deep-sea tend to have a higher impact with respect to fishes habiting coastal areas. When it comes to the fishing gears, trawling and longlining lead to higher emissions with respect to the seining method.
Klimato Dictionary:
- Longlining: uses baited hooks on offshoots of a single main line.
- Seining: purse seines are walls of netting used to encircle entire schools of fish at or near the surface.
- Trawling: towing a net through water.
Bottom trawling is the method of fishing responsible for the greatest environmental damage, as the net is weighted down with heavy cables and rollers over the ocean floor, scraping everything in its path.
|
Fishing area |
Species |
Fishing gear |
CO₂e/kg produce |
|---|---|---|---|
|
Offshore |
Lobster |
Trawling |
25.5 |
|
Offshore |
Tuna |
Lining |
13.3 |
|
Offshore |
Anglerfish |
Trawling |
9.38 |
|
Offshore |
Swordfish |
Lining |
9.27 |
|
Offshore |
Hake |
Trawling |
6.26 |
|
Deep-sea |
Plaice |
Trawling |
5.9 |
|
Offshore |
Hake |
Lining |
5.7 |
|
Offshore |
Octopus |
Varied |
4.11 |
|
Offshore |
Squid |
Varied |
3.86 |
|
Farmed |
Salmon |
Farmed |
3.84 |
|
Offshore/coastal |
Haddock |
Varied |
3.37 |
|
Offshore |
Eel |
Lining |
3.07 |
|
Offshore |
Giant prawn |
Varied |
3.05 |
|
Coastal |
Trout |
Varied |
3.02 |
|
Offshore |
Ling |
Lining |
2.47 |
|
Coastal |
Carp |
Seining |
1.81 |
|
Coastal |
Pollock |
Artisanal |
1.49 |
|
Coastal |
Cod |
Artisanal |
1.49 |
|
Coastal |
Turbot |
Artisanal |
1.49 |
|
Coastal |
Scallop |
Artisanal |
1.49 |
|
Coastal |
Squid |
Artisanal |
1.49 |
|
Coastal |
Prawn |
Artisanal |
1.48 |
|
Deep-sea |
Tuna |
Seining |
1.44 |
|
Coastal |
Mackerel |
Trawling |
1.18 |
|
Coastal |
Mackerel |
Seining |
0.93 |
|
Coastal |
Bass |
Seining |
0.74 |
|
Coastal |
Pilchard/sardine |
Seining |
0.74 |
|
Coastal |
Herring |
Seining |
0.51 |
|
Farmed |
Mussels |
Farmed |
0.08 |
|
Values are extracted from the Klimato database which contains data from peer reviewed papers, conference proceedings and open source databases. |
|||
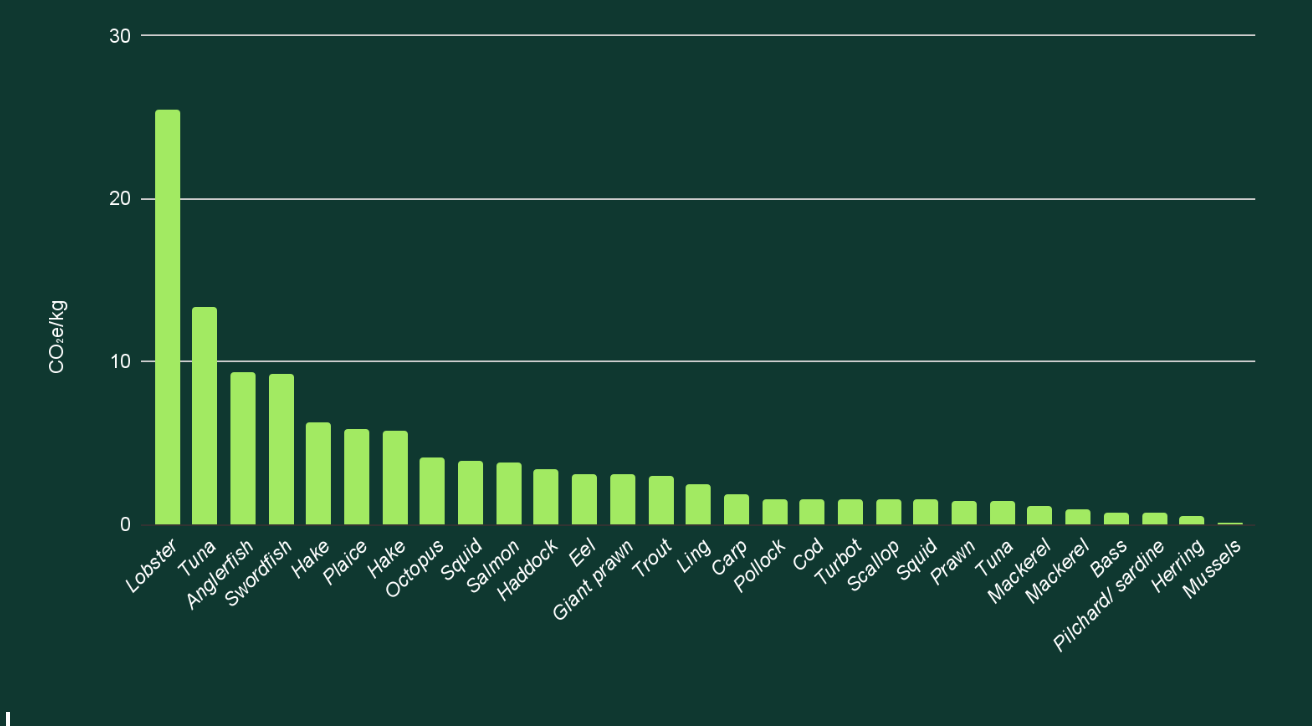
Klimato’s Sustainable swap:
Some swaps that are recommended by our science team is to choose fish that swim at the surface of the water or seafoods like mussels that have a low carbon footprint since, even if farmed, they do not require feed.
1.2 Eggs
Feed inputs make the greatest contribution to carbon emissions, and are therefore the main factor influencing the carbon footprint of egg production systems.
Klimato’s Sustainable swap:
Aquafaba is the cooking water of dried chickpeas, or the water in chickpeas cans. Just like eggs, it is a binder and can replace whipped eggs in recipes. And the best part? It produces 0 kg CO2e. It might sound far-fetched but that is very much the case, since at the point of chickpea cooking, the cooking water is usually treated as waste. Therefore, the environmental burdens of chickpea cultivation and processing is entirely attributed to the cooked chickpeas, leaving the unprocessed aquafaba as a burden-free product (2).
1.3 DAIRY
|
Ingredient |
CO₂e/kg |
Ingredient Swap |
CO₂e/kg |
Carbon saving |
|---|---|---|---|---|
|
Butter |
10.77 |
Vegan butter |
2.57 |
76% |
|
Cheese |
8.32 |
Vegan cheese |
2.90 |
65% |
|
Cream |
6.45 |
Vegan cream |
1.30 |
80% |
|
Milk |
1.64 |
Oat milk |
0.5 |
70% |
|
Mayonnaise |
2.63 |
Vegan mayo |
0.83 |
68% |
|
Values are extracted from the Klimato database which contains data from peer reviewed papers, conference proceedings and open source databases. |
||||
The farming stage, and in particular cow rearing for milk production, is the most impacting stage of dairy products in terms of greenhouse gas emissions (as well as nutrient pollution and land use). This is due to enteric fermentation (the microbial decomposition of feed in the rumen of the animal that is released as flatus and belch) and fertilizers used for feed production which release methane and nitrous oxide respectively.
In addition, dairy products require large amounts of raw milk and energy for processing. Butter, in particular, requires up to 10-20 kg raw milk per kg of butter. (3)
Klimato’s Sustainable swap:
The best way to reduce the carbon impact of dairy products is to use vegan alternatives of the same product. Plant-based milk and cheese alternatives as well as nutritional yeast are good swaps for milk and cheese.
The question might arise which type of plant-based milk alternatives are best in terms of eco consciousness. We have a pretty clear answer on that: all plant based milks release between 60-80% less emissions than cow milk (4). Differences among plant-based milks are due to the country of production of the raw material, the amount of fertilizer used or the need for electricity to power irrigation pumps.
2. CONDIMENTS
|
Ingredient |
CO₂e/kg |
Ingredient Swap |
CO₂e/kg |
Carbon saving |
|---|---|---|---|---|
|
Olive oil |
5.63 |
Sunflower oil |
2.96 |
47% |
|
Bearnaise sauce |
4.87 |
Horseradish sauce |
2.63 |
42% |
|
Rapeseed oil |
3.15 |
Sunflower oil |
2.96 |
6% |
|
Beef stock |
3.12 |
Vegetable stock |
2.44 |
22% |
|
Values are extracted from the Klimato database which contains data from peer reviewed papers, conference proceedings and open source databases. |
||||
2.1 Olive oil
The relatively high impact of olive oil production lies in the olive cultivation which needs multiple plant protection treatments (which means high fuel use from the use of machinery). On average, most machinery used is also quite old (15-20 years) which leads to even higher fuel emissions. The milling phase typically uses traditional extraction processes which means that low amounts of olive are pressed into olive oil at the time increasing the energy requirements. Finally, 20% of the total climate impact of olive oil is due to its packaging in glass bottles (5).
Klimato’s Sustainable swap:
Switching to sunflower oil will result in significant carbon savings of 55%. We also suggest that you opt for olive oil packaged in plastic bottles as long as you dispose of it appropriately.
2.2 Bearnaise sauce
CO2e emissions of sauces increase when adding animal products, such as eggs and dairy.
Klimato’s Sustainable swap:
Choose a sauce that contains less animal products, or the best is to opt for a vegan option in order to reduce the carbon footprint.
2.3 Beef stock
Beef stock has a high carbon impact due to the dehydration process which requires a considerable amount of energy and also because it is an animal product.
Klimato’s Sustainable swap:
Vegetable stock still has a fairly high carbon footprint but in comparison to beef it is much lower (6).
3. CARBOHYDRATES
|
Ingredient |
CO₂e/kg |
Ingredient Swap |
CO₂e/kg |
Carbon saving |
|---|---|---|---|---|
|
Rice |
3.7 |
Pasta |
1.54 |
58% |
|
3.7 |
Quinoa |
0.82 |
78% |
|
|
3.7 |
Potatoes |
0.22 |
94% |
|
|
Values are extracted from the Klimato database which contains data from peer reviewed papers, conference proceedings and open source databases. |
||||
3.1 Rice
Rice cultivation is responsible for 10-13% of worldwide methane emissions (7), making it the worst carbohydrate for the climate. This is due to methanotrophs (soil microorganisms) in the paddy fields producing the strong greenhouse gas methane.
Klimato’s Sustainable Swap:
Some easy choices for saving carbon:
- Quinoa: 57%
- Bulgur/couscous: 74%
- Potato: 93%
4. FRUIT AND VEGETABLES
|
Ingredient |
CO₂e/kg |
Ingredient Swap |
CO₂e/kg |
Carbon saving |
|---|---|---|---|---|
|
Raisin |
3.10 |
Walnuts |
2.19 |
29% |
|
Dried banana |
4.88 |
Banana |
0.4 |
92% |
|
Dried tomatoes |
5.14 |
Tomatoes |
0.74 |
86% |
|
Values are extracted from the Klimato database which contains data from peer reviewed papers, conference proceedings and open source databases. |
||||
4.1 Raisins
Dried produce (e.g. raisins and other dried fruits such as dried apricots, banana, mango, dried chilli peppers etc.) have a higher carbon footprint compared to fresh food. In the drying process a considerable amount of water is removed, therefore, to make 1kg of dried fruit, you need between 1.5-4 kg of fresh produce (8). In addition, unless sun-drying, energy is required for the drying process.
Klimato’s Sustainable Swap:
All nuts have low CO2e emissions and are good alternatives to dried fruits. Peanuts for example have slightly lower CO2e emissions than other tree nuts (9).
Fun Fact: Peanuts are actually classified as a legume crop and not tree nuts.
Legumes have the special ability to fix nitrogen from the atmosphere into the soil, and therefore they need lower amounts of nitrogen fertiliser. They also require less irrigation which means that energy and machineries are used at a lower rate.
4.2 Fruit and vegetable farming methods: Greenhouse vs open field
Heated greenhouses require significant energy for heating and lighting, resulting in higher carbon emissions compared to fruit and vegetables produced in open fields. Open field production is possible only when the produce is cultivated during its natural growing season. It’s worth noting that transportation (excluding air-travel) accounts for only 6% of the overall carbon footprint of most food products (10). Therefore, the country of origin contributes less to the fruit and vegetables carbon footprints than the farming method making seasonal food the best choice.
Klimato’s Sustainable Swap:
The rule of thumb when it comes to sourcing fruit and vegetables is to make sure they are grown in an open field.
5. To wrap it all up
- Choose fish that swim at the surface of the water.
- Chickpea cooking water is treated as waste (the cultivation and processing of the chickpeas is unaccounted), therefore unprocessed aquafaba as an egg replacement has zero carbon footprint making it super sustainable!
- To produce 1 kg of butter you need 10-20kg of raw milk. Opt instead for vegan alternatives.
- Dehydration of fruits or stock requires a lot of energy. For dried fruits opt for fresh fruits or walnuts/peanuts instead.
- Rice cultivation is responsible for 10-13% of worldwide methane emissions. Swap to bulgur, couscous, quinoa or potatoes instead.
- Choose fruit and vegetables that are grown in an open field rather than in a heated greenhouse. Local isn’t necessarily better so if that product isn’t in season in your country, choose the same product from a country where it is in season (avoid air-travel though).
|
Category |
Ingredient |
CO₂e/kg |
Ingredient Swap |
CO₂e/kg |
Carbon saving |
|---|---|---|---|---|---|
|
Animal |
Chicken |
5.98 |
Tofu |
1.95 |
67% |
|
Beef |
34.67 |
lentils |
0.77 |
98% |
|
|
Shrimp |
18.02 |
mussels |
1.62 |
91% |
|
|
Pork |
7.07 |
Beans |
0.77 |
89% |
|
|
Haddock |
3.62 |
Pollock |
0.99 |
73% |
|
|
Cod |
2.29 |
pollock |
0.99 |
57% |
|
|
Eggs |
3.69 |
chickpea water (aquafaba) |
0 |
100% |
|
|
Dairy |
Butter |
10.77 |
vegan butter |
2.57 |
76% |
|
Cheese |
8.32 |
vegan cheese |
2.90 |
65% |
|
|
Cream |
6.45 |
vegan cream |
1.30 |
80% |
|
|
Milk |
1.64 |
oat milk |
0.5 |
70% |
|
|
Mayonnaise |
2.63 |
vegan mayo |
0.83 |
68% |
|
|
Condiments |
Olive oil |
5.63 |
sunflower oil |
2.96 |
47% |
|
Bearnaise sauce |
4.58 |
horseradish sauce |
2.63 |
43% |
|
|
Rapeseed oil |
3.15 |
sunflower oil |
2.96 |
6% |
|
|
Beef stock |
3.12 |
vegetable stock |
2.44 |
22% |
|
|
Carbohydrates |
Rice |
3.7 |
pasta |
1.54 |
58% |
|
3.7 |
quinoa |
0.82 |
78% |
||
|
3.7 |
potatoes |
0.22 |
94% |
||
|
Fruits & Vegetables |
Raisin |
3.10 |
walnuts |
2.19 |
29% |
|
Dried banana |
4.88 |
Banana |
0.4 |
92% |
|
|
Dried tomatoes |
5.14 |
Tomatoes |
0.74 |
86% |
|
|
Values are extracted from the Klimato database which contains data from peer reviewed papers, conference proceedings and open source databases. |
|||||
Sources
- Ziegler, et al., 2013
- Saget, et al., 2021
- Djekic, et al., 2014
- Singh-Povel, et al., 2022
- Pattara, et al., 2016
- Milà i Canals, et al., 2011
- Bronson et al., 1997
- Frankowska, et al., 2019
- Volpe et al., 2015
- Crippa, et al., 2017