Have you ever wondered about the carbon footprint of beef VS chicken? We'll here's you chance! Get to know the basics of different food emissions as we explore the impact from various food groups.
How carbon emissions of food is measured - A very short introduction to LCA
Greenhouse gas emissions calculation of food is a serious science backed process that is done through LCA or Life Cycle Assessment that meticulously tracks the carbon footprint of ingredients from production to store shelves (farm to industry gate). The impact is measured in kg CO2e (carbon dioxide equivalents) - which essentially is the accumulation of different greenhouse gases (including carbon dioxide, nitrous oxide and methane). You may have heard the term carbon emissions (instead of greenhouse gas emissions). The term carbon emissions is not precise from a scientific point of view, since food production involves emissions of other gasses different from carbon dioxide. Nevertheless, the term carbon emissions has entered our vocabulary and we will use it hereafter.
We created this analysis to give a general understanding on the carbon emission of basic food components’. As a continuation of this series of posts, we also built a more in-depth expert cheat sheet for food professionals in which we discover how to substitute ingredients with ones that have lower emissions to achieve a more cost efficient and eco-conscious way of preparing dishes.
1. The Carbon emission of Protein
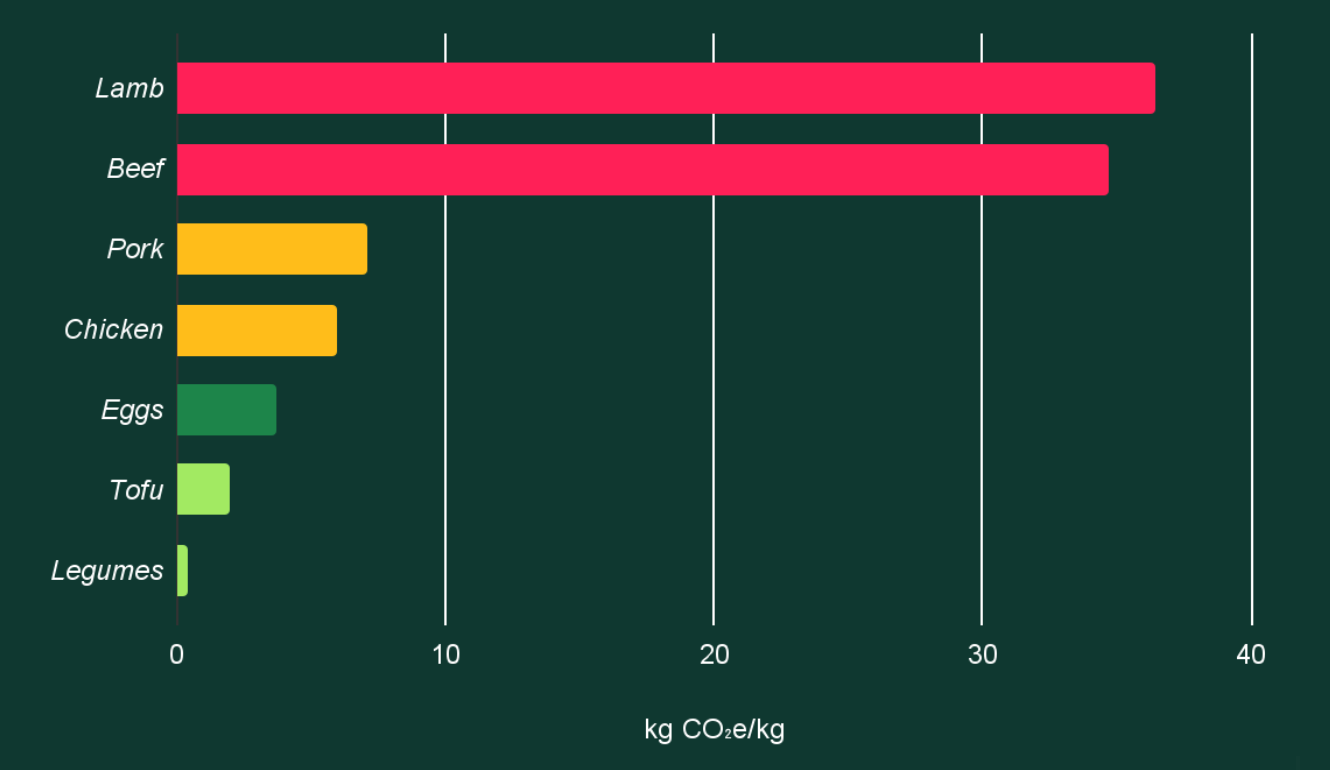
Values are extracted from the Klimato database which contains data from peer reviewed papers, conference proceedings and open source databases.
It's not a big surprise for anyone that meat has the highest carbon footprint of any component. Red meat has a carbon footprint of around 35 kg CO2e/kg due to ruminating animals (like cows, sheep, and goats) producing methane through their belch (1).
Chicken and pork, however, have a lower carbon footprint (5.98 kg CO2e/kg and 7.07 kg CO2e/kg respectively) making them substitutes. An even better alternative for meat are legumes and pulses (lentils, beans, peas, soy) or tofu, all of which have a carbon footprint that’s only 5% of what beef emits (1).
2. The Carbon emission of Dairy
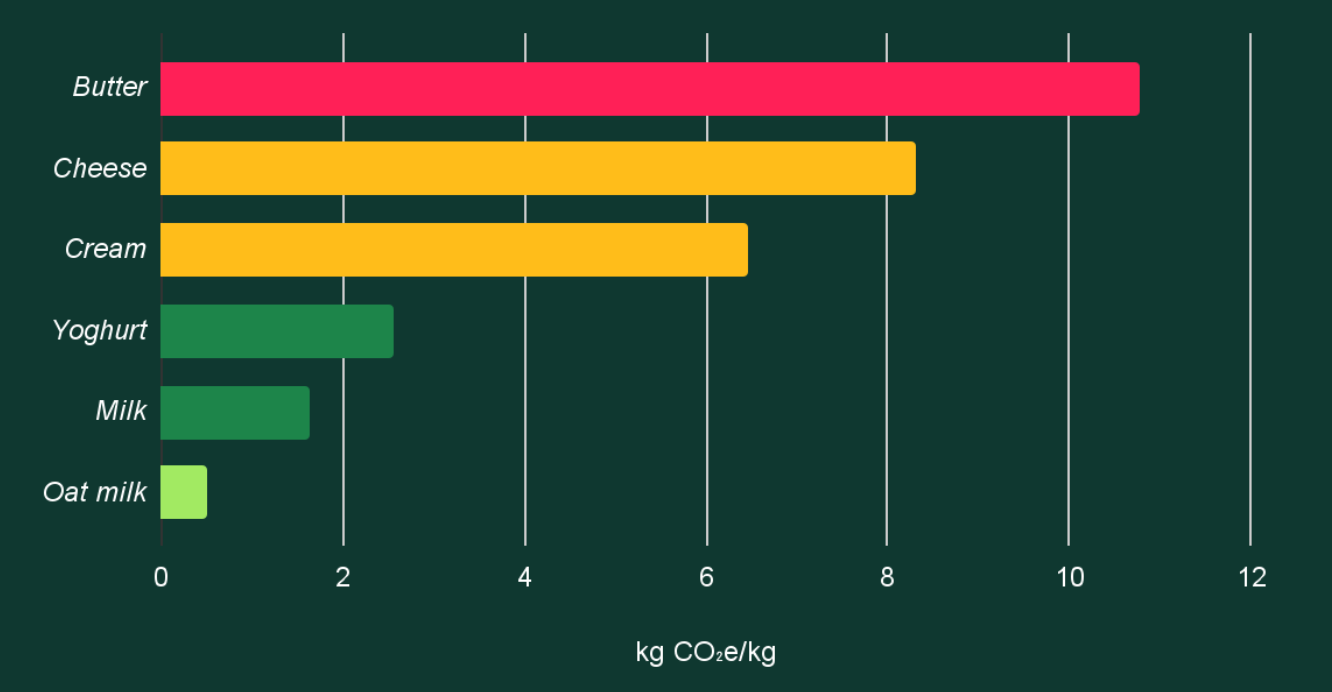
Values are extracted from the Klimato database which contains data from peer reviewed papers, conference proceedings and open source databases.
When it comes to dairy, butter is the biggest emitter at 10.77 kg CO2e/kg (1). This is due to requiring large amounts of raw milk, actually 10 to 20 times more than producing milk and 4 to 5 times more than cheese (2). A more climate conscious alternative to butter is vegetable oils, with an average impact of 3.66 kg CO2e/kg, which is about one third compared to butter (1).
Cheese being a food product that many find to be the hardest ingredient to swap out for a lower emitting one. With an average of around 8 kg CO2e/kg (1), cheese nearly qualifies in the heavyweight class alongside butter when it comes to greenhouse gas emission.
There are plenty of plant-based alternatives popping up with about half the climate impact. Nutritional yeast for example emits 32% less than traditional cheese, making it a sustainable and delicious choice (1,3).
3. The Carbon emission of Fish
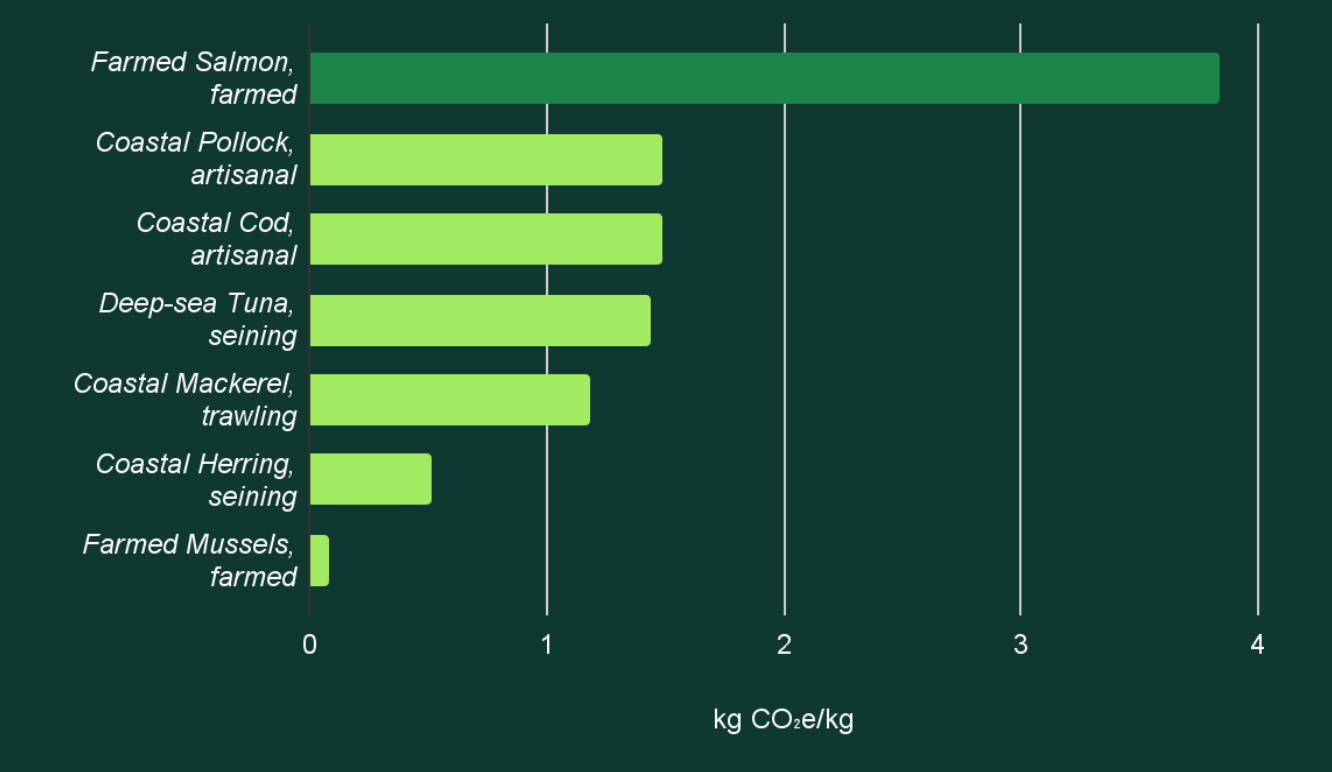
Trawling for shellfish is a very fuel-intensive method and damages the sea floor. When lobsters and prawns are caught, other species are caught in the net too, adding to the carbon footprint.
Farmed fish also have their own hotspots for carbon emissions, with feed production and farm energy use. To minimize the impact, fish that swim closer to the surface is a better choice so as it does not damage the seafloor. There are also exceptions when it comes to shellfish, for example mussels on average have a quite low carbon footprint of around 0.08 kg CO2e/kg (4).
Here are a few examples of the least to the most impactful finfish (4):
Low: pilchards, pollock, carp, herring and mackerel
Medium: salmon, cod and trout
High: hake, anglerfish, swordfish and turbot
4. The Carbon emission of Carbohydrates
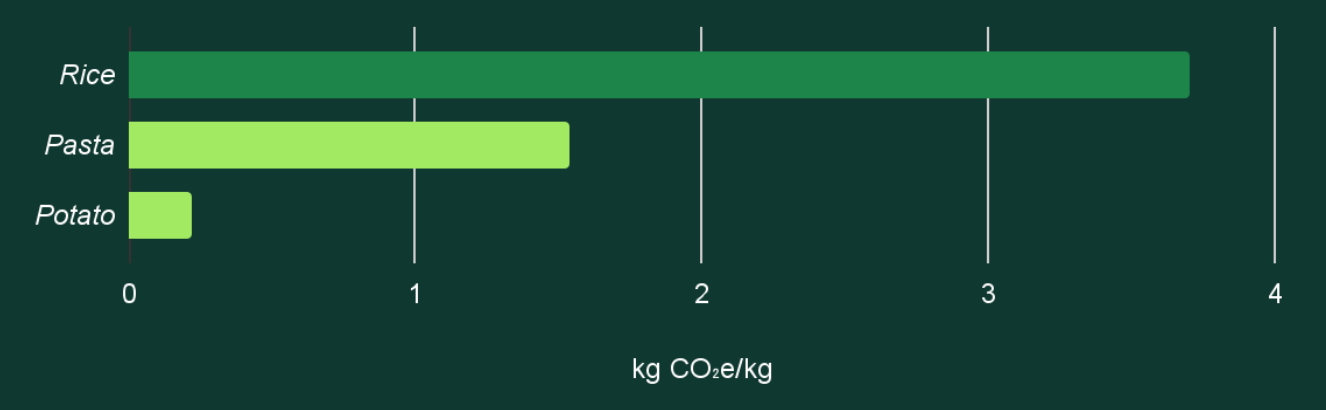
Values are extracted from the Klimato database which contains data from peer reviewed papers, conference proceedings and open source databases.
Rice has a high carbon footprint of about 3.7 kg CO2e/kg, compared to potatoes which has an average value of 0.22 kg CO2e/kg (3) and pasta which has an average value of 1.54 kg of CO2e/kg (1).
Rice cultivation is responsible for 10-13% of worldwide methane emissions (5) putting rice on the top of the list when it comes to emission-heavy carbohydrates. This is due to methanotrophs (soil microorganisms) in the paddy fields producing a strong greenhouse gas - methane.
Wheat cultivation releases low methane emissions. So the carbon footprint of pasta is lower than rice, even if pasta is an industrial product and undergoes a processing step. In fact, wheat milling and pasta manufacturing accounts for only 20% of the total carbon footprint of pasta (6).
Potatoes are low in calories, rich in nutrients (vitamin B and C, potassium), low in fat and they have a very low carbon footprint. Potato production is characterized by high yields and relatively low fertilizer amounts. However, potato ranks third behind rice and wheat as food consumed, since consumption of fresh potatoes has declined while processed products (like pasta) have increased in popularity (6).
5. The Carbon emission of Fruit & Vegetables
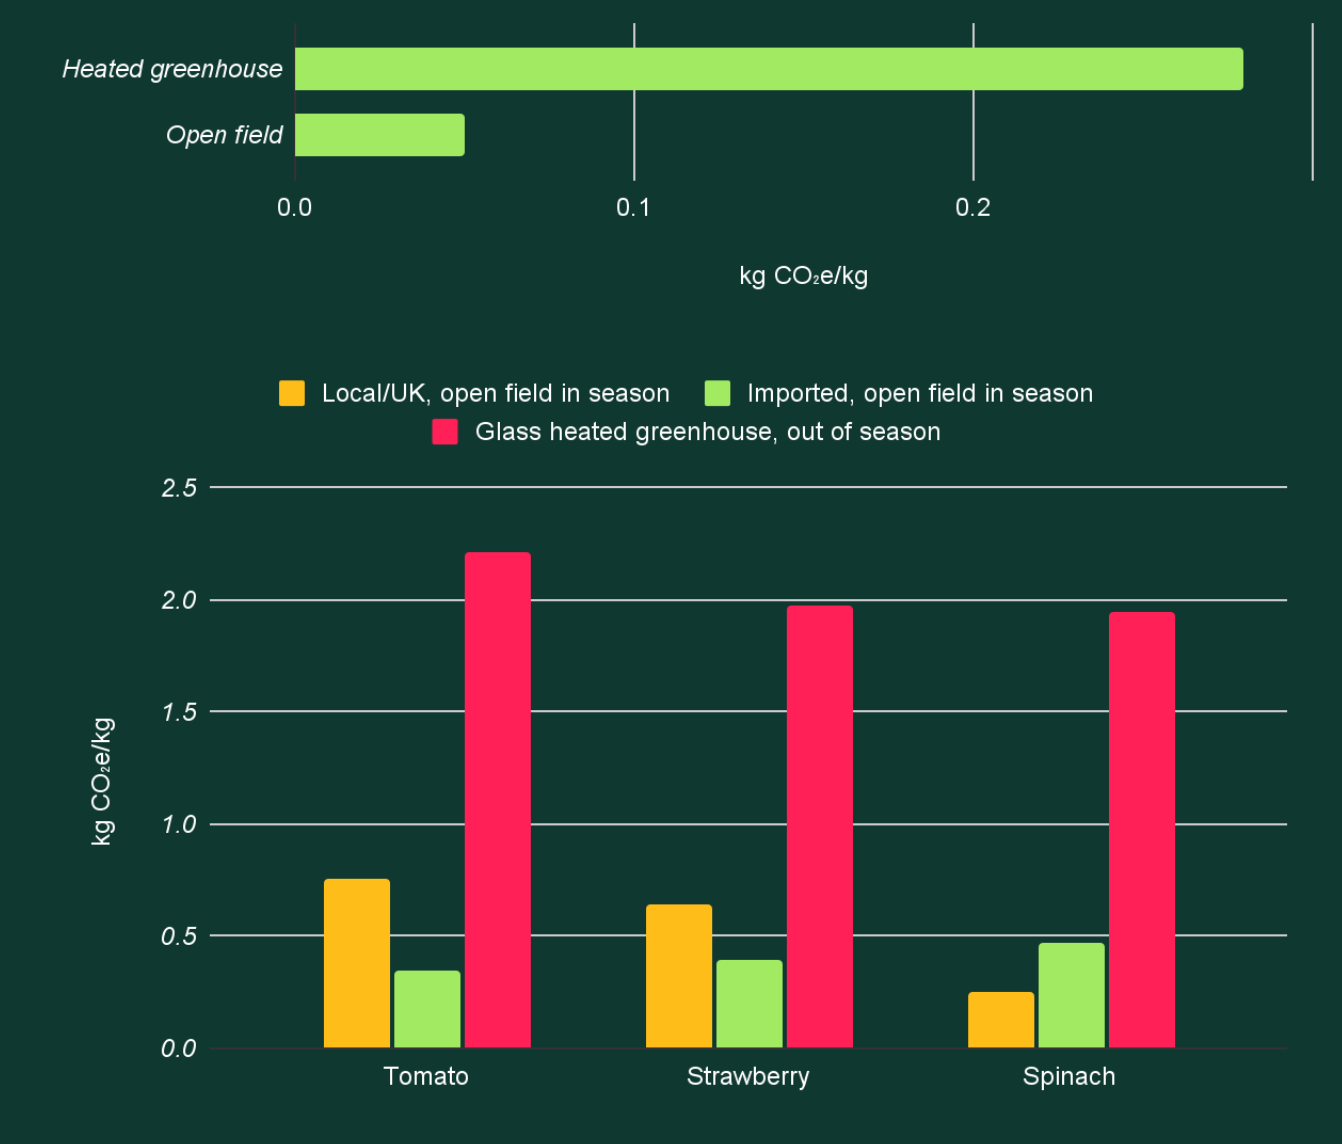
Fruits and vegetables are on the lower scale of climate friendly ingredients. While they generally have a lower carbon footprint, there is a difference between produce grown in an open field (0.5 kg CO2e/kg) and those cultivated in heated greenhouses (2.81 kg CO2e) (7).
Heated greenhouses require significant energy for heating and lighting, resulting in higher carbon emissions. The most eco conscious choice is to buy fruit and vegetables that are grown in season and in a local open field. For instance when it comes to tomatoes in the middle of March, opting for Spanish grown tomatoes from an open field, rather than UK grown tomatoes from a heated greenhouse (8,9). It’s worth noting that transportation (excluding air-travel) accounts for only around 5% of the overall carbon footprint of most food products (10).
To wrap it all up
- Meat and dairy have high carbon emission levels, so alternatives like legumes and tofu are considered best but even chicken is a more decent replacement.
- Prioritizing fish that swim closer to the surface, such as pollock, herring and mackerel is more environmentally friendly rather than deep sea species like cod.
- Pasta or potatoes are better carbohydrate options than rice.
- It is recommended opting for local and in-season produce whenever possible. Otherwise an ingredient is a good alternative if it is in season but grown abroad in an open field rather than local but greenhouse grown.
Sources
- Poore et al., 2018
- Djekic et al., 2014
- Agribalyse 3.1 (ADEME, 2022)
- Klimato Carbon Footprint Database
- Bronson et al., 1997
- Bevilacqua et al., 2013
- Clune et al., 2017
- Neira et al., 2018
- Denny et al., 2012
- Crippa et al., 2017